Partnerships for the Goals
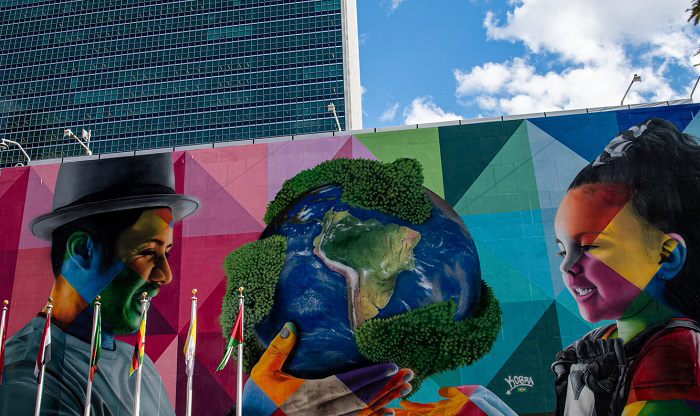
An Eduardo Kobra mural at United Nations Headquarters in New York, donated by Brazil’s Permanent Mission, portrays sustainable development: balancing present needs without compromising the Earth’s ability to meet future generations’ needs
© UN Photo/Rick Bajornashighlighting the importance of a collective surge in action to provide developing countries with the necessary financing and technologies to accelerate the implementation of the SDGs.
In the wake of the pandemic, many developing countries are facing a debt crisis
The debt levels of many countries reached record highs during the pandemic, posing a potential threat to economic growth. The total external debt of low- and middle-income countries reached $9 trillion in 2021, recording a 5.6 per cent increase from 2020. The rise was primarily driven by an increase in short-term debt. Close to 7 in 10 countries in LDCs and LLDCs experienced a higher debt-to-export ratio in 2021 compared with 2015.
Moreover, challenges such as high inflation, competing priorities and rising borrowing costs have exacerbated the risk of debt distress. As of November 2022, more than half (37 out of 69) of the world’s poorest countries were either at high risk of, or already in, debt distress. Meanwhile, one in four middle-income countries, home to the majority of the extreme poor, faced a high risk of fiscal crisis. Some countries with unsustainable levels of debt service have already opted for sovereign debt restructuring, while others remain vulnerable.
Debt service as a proportion of exports of goods and services, 2015, 2020 and 2021 (percentage)
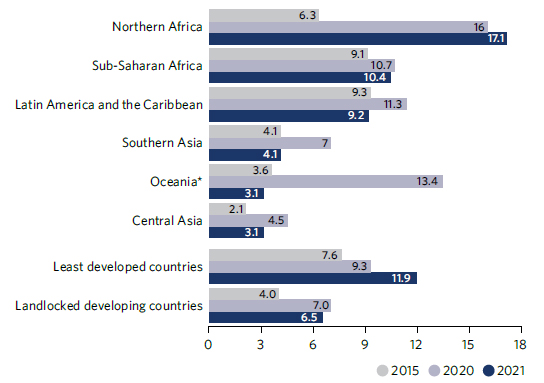
*Excluding Australia and New Zealand.
Despite record-breaking global trade increases, the share of exports from least developed countries has stagnated and is far off target
Exports of merchandise and services were already slowing down in 2019, but 2020 saw a decline comparable to the recession of 2009. As pandemic-related restrictions were gradually lifted, global exports increased sharply, by 24.8 per cent in 2021 and 12.3 per cent in 2022. Global trade reached a record $32 trillion in 2022. Trade in goods accounted for about $25 trillion (an increase of about 11.5 per cent from 2021) and trade in services totalled about $7 trillion (an increase of about 15.3 per cent from 2021). However, the outlook for global trade in 2023 appears subdued, as a result of deteriorating economic conditions.
The share of exports from LDCs in global merchandise trade was merely 1.1 per cent in 2022, only a 0.07-percentage-point increase from 2021. The target of doubling the share of LDCs’ exports by 2020, from its value of 1.02 per cent in 2011, has therefore not been met. On the other hand, all developing countries combined saw an increase in their share of global merchandise trade, reaching 45.3 per cent in 2022, a rise of 4 percentage points compared with 2016. This upward trend has been sustained over the past six years.
Official development assistance surged in 2022 owing to spending on refugees in donor countries and aid to Ukraine
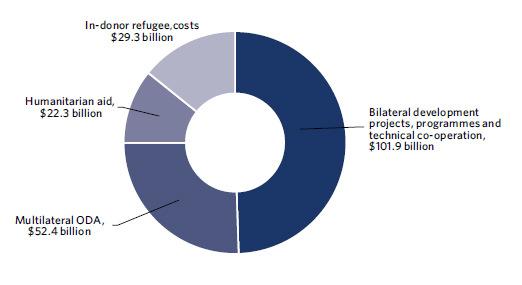
In 2022, net ODA flows by member countries of the Development Assistance Committee (DAC) reached $206 billion (current price), marking an increase of 15.3 per cent in real terms from 2021.1 This was the fourth consecutive year ODA surpassed its record levels, and one of the highest growth rates recorded in its history. However, total ODA as a percentage of gross national income continues to remain below the target of 0.7 per cent, reaching 0.37 per cent in 2022.
The increase was primarily due to domestic spending on refugees and aid for Ukraine. Refugee costs in donor countries amounted to $29.3 billion in 2022, representing 14.2 per cent of DAC member countries’ total ODA. Net ODA to Ukraine accounted for $16.1 billion, representing 7.8 per cent of total ODA. Initial estimates indicate that DAC countries spent $11.2 billion on activities related to COVID-19-, down by 45 per cent compared with 2021. Net bilateral ODA flows to African countries experienced a real-term decline of 7.4 per cent compared with 2021.
Components of net ODA, preliminary data, 2022 (current dollars)
Internet usage reaches two-thirds of the world’s population, but gender and connectivity gaps persist
An estimated 5.3 billion people – 66 per cent of the world’s population – used the Internet in 2022. This reflects a substantial increase of 65 per cent from the 40 per cent coverage observed in 2015. The growth rate was 6.1 per cent over 2021, but it falls short of the 11 per cent growth witnessed during the initial stages of the COVID-19 pandemic in 2019–2020. Nevertheless, 2.7 billion people are still offline, highlighting that substantial work is still needed to achieve the universal connectivity target by 2030. Universal connectivity remains particularly challenging in LDCs and LLDCs, where only 36 per cent of the population is currently online.
Globally, 69 per cent of men are using the Internet, compared with 63 per cent of women. This means there were 259 million more male Internet users than female users in 2022.
Proportion of individuals using the Internet, 2015 and 2022 ( percentage)
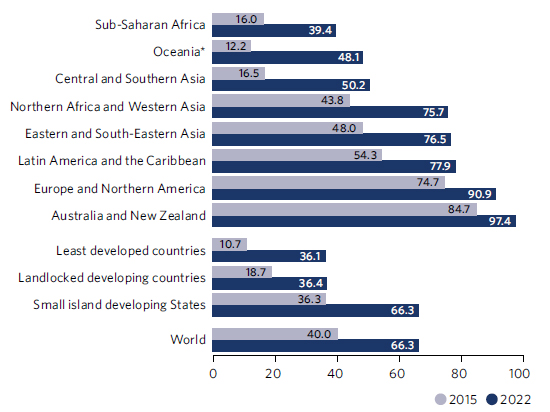
*Excluding Australia and New Zealand.
The world needs more timely, detailed and accurate data to tackle a multitude of crises, but funding for data and statistics is ever more scarce
International funding for data and statistics amounted to only $541 million in 2020, a decrease of more than $100 million and $138 million from funding levels in 2019 and 2018, respectively. Between 2018 and 2020, ODA funding for data dropped by more than 20 per cent. The reduced funding for statistics may impact the most vulnerable countries disproportionately. While data showed international funding bounced back to an estimated amount of $693 million in 2021, this increase was mainly due to one donor, and total funding remained insufficient to meet the growing need for more and better data. Countries still face long-standing challenges in mainstreaming data activities, with a limited pool of donors and low strategic priority generally assigned to statistics.
A total of 156 countries and territories were implementing a national statistical plan in 2022, up from 150 in 2021, with 100 of these plans fully funded. However, due to the long-lasting impact of the pandemic and limited capacity in strategic planning, many national statistical offices are implementing expired strategic plans that may not meet emerging data needs.
Status of implementation of statistical plans, 2022, (number of countries and territories)
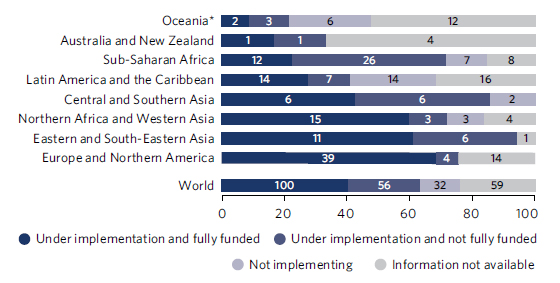
*Excluding Australia and New Zealand.
1 Since 2018, the OECD has been publishing data on headline ODA volume and ODA as proportion of GNI on the grant equivalent basis. SDG 17.2.1 is measured on a net ODA basis; therefore, the figures presented here may differ slightly.

